🧠 How I Think About Data
My research at MIT taught me that humans don’t just see data—they construct meaning. I design solutions with this in mind, optimizing dashboards for natural eye movement and building ML systems that can explain their reasoning.
Featured Writing
A mix of notes & experiments, data narratives, and essays & perspectives—built to show how I approach messy problems.
Data Narrative
The Beekeeper’s Time Machine
Explore how extracting timestamps and visual features from years of my own hive photos lets me travel through inspection history, revealing rhythms, surprises, and insights that would otherwise remain hidden.
Read the story →Tutorials & Guides
Building a Sustainable Digital Home
A supportive, skills-forward series that helps you launch a personal website, automate publishing, document your process, and build a platform you’ll actually want to keep using over time.
Open the guide →Applied Thinking
Making Mermaid Diagrams Work for You
Cut through the chaos of tangled graph drawings with practical tips and structured approaches that bring confidence to crafting Mermaid diagrams that actually convey what you mean.
Read the post →Cognitive Principles in Practice
Metadata Matters
Just as our brains rely on associations to retrieve memories, the web relies on metadata to surface meaning from the void.
More on metadata, the digital equivalent of cognitive context →Cognitive Offloading
Leverage preattentive attributes—like position and luminance—to design dashboards that respect the brain's processing limits.
Designing for How People Actually See →Grow from Messiness
Life rarely fits into neat database schemas. I used ML on my real-world exercise data, granting me trust in my own metrics again.
Why perfect data is not a prereq for a healthy system →Featured Projects
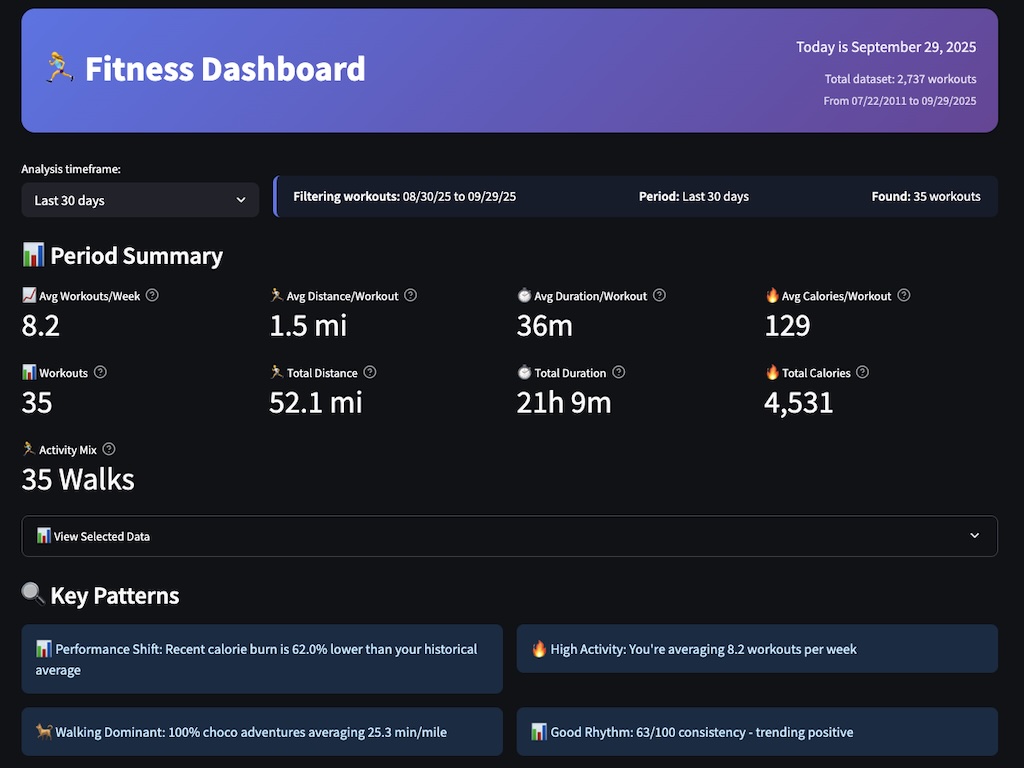
Self-Hosted Workout Intelligence
Attention patterns reveal signal in 14 years of messy data.
When my running data collided with daily dog walks, every workout got mislabeled as a “run”—even the 30 minute sniff walks. I built a full pipeline (auto csv export → λ → → ) that classifies runs vs. walks using ML, with built-in model retraining for transparency.
Cognitive insight: Humans recognize patterns through contrast and repetition—this system leverages both to surface the real story in behavioral data.
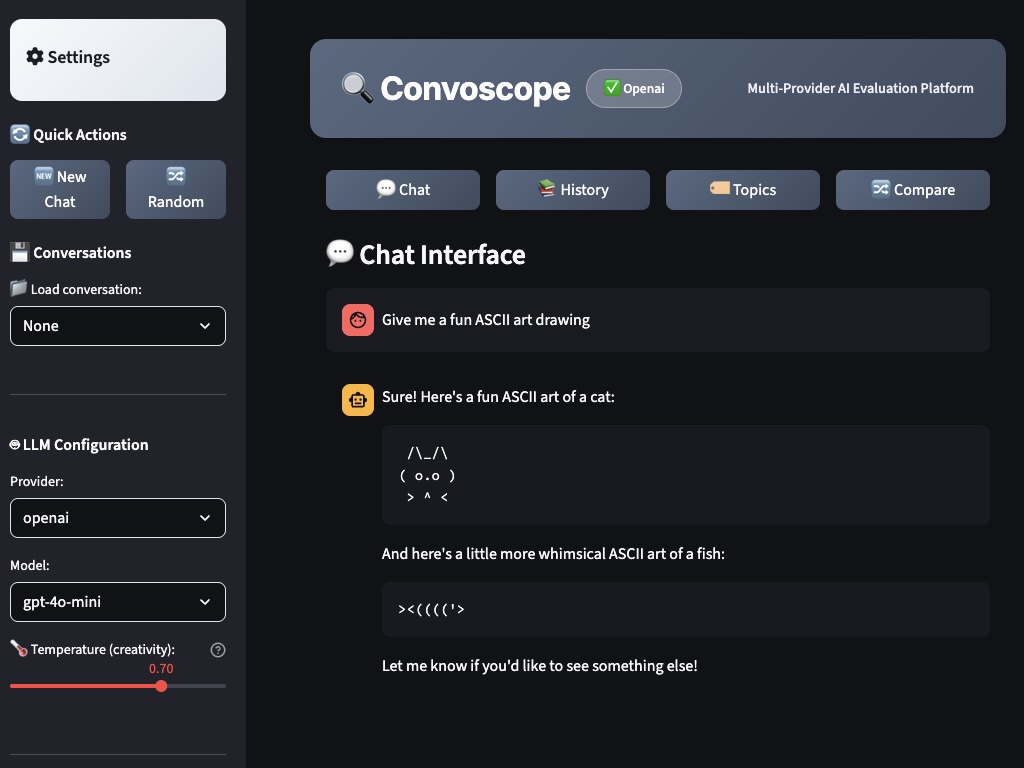
Conversational AI Management
Multi-modal comparison designed for cognitive load management.
Hopping between AI providers while losing track of what worked where felt increasingly inefficient. Convoscope is my solution: one interface, multiple models (OpenAI, Anthropic, Google), persistent conversation history, and automatic topic extraction. It’s a flexible workspace for comparing outputs side-by-side.
Cognitive insight: Working memory can only hold 7±2 items—by offloading comparison to visual space, we free cognitive resources for actual thinking.
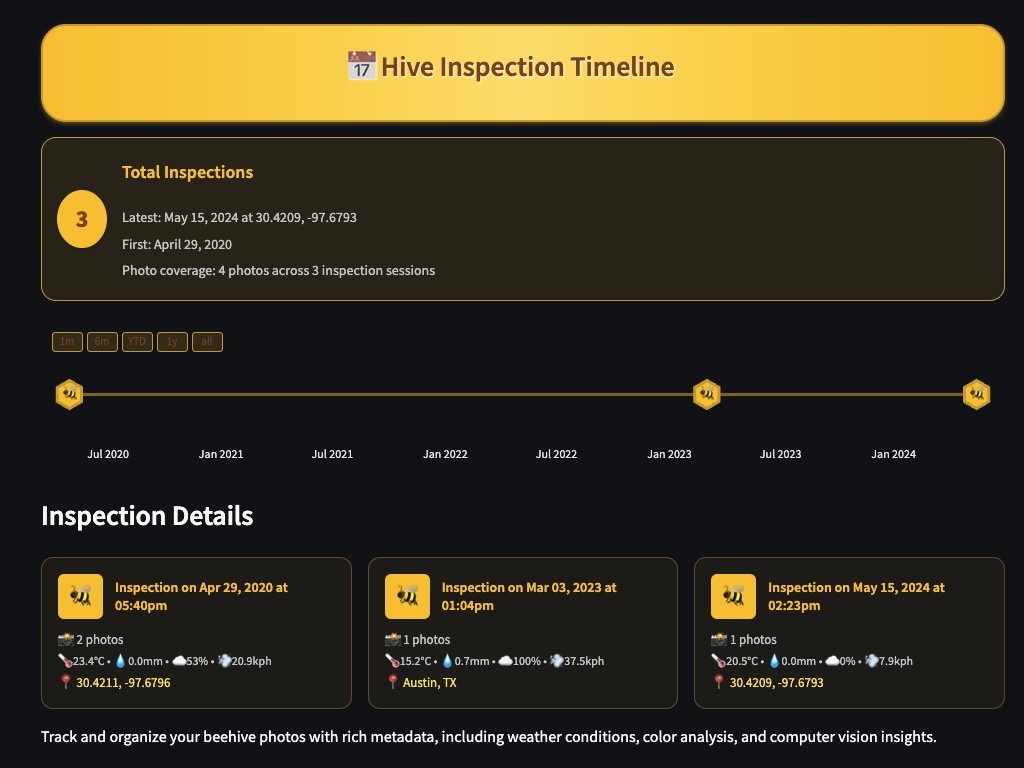
Beehive Analytics Platform
Computer vision meets human memory to structure 4 years of visual documentation.
Four years of unlabeled bee photos became a living knowledge base by combining EXIF metadata, Google Cloud Vision, and weather APIs. The result: a knowledge graph with a query UI that surfaces patterns—when swarms happened, which seasons were productive, what weather preceded problems.
Cognitive insight: Human memory is associative, not chronological—this system mirrors how beekeepers actually recall and connect observations.
At-a-Glance: Education & Big Moves
Quick visual timeline of the milestones that shaped my path — from UT Austin and MIT to data science and consulting.
🔬 Currently Exploring
Interested in discussing any of these? Let's connect